

Have you ever read a research paper and felt overwhelmed by rows of numbers, tables, and figures that just… keep coming? That’s a classic case of data dumping—when someone throws all their findings onto the page without guiding the reader.
Fortunately, you can avoid this. In this blog, we’ll show you how to present data, tell a story with your findings, and help your reader understand what truly matters.
What Is Data Dumping and Why Should You Avoid It?
Data dumping happens when you present a lot of raw information without structure, explanation, or flow. While it might seem thorough, it usually confuses your reader rather than helping them.
Common signs of data dumping:
- Long tables with no introduction or summary
- Multiple graphs in a row without explanation
- Repeating every number from your spreadsheet
- No connection between the data and your research question
Instead of dumping, your goal should be to explain data simply, so readers know exactly what they’re looking at—and why it matters.
Start with a Clear Data Strategy
Before inserting charts or tables, pause and ask yourself: What’s the point of this data?
To organize your thoughts, try this step-by-step process:
- Restate your research question or objective
- Choose the most relevant data only
- Group related data together for a smoother flow
- Label all visuals clearly (e.g., “Table 2: Student Performance by Gender”)
By being intentional, you guide your reader through your data story—instead of dropping numbers on them.
Explain Data Like You’re Talking to a Friend
It’s easy to fall into academic jargon but remember: your reader wants clarity, not complexity.
Here’s how to explain data simply:
- Use everyday language
- Begin each section with a summary
- Avoid repeating numbers that are already in a table
- Always follow up data with interpretation
Example (Bad):
“Table 3 shows the mean, median, and standard deviation of test scores. Table 4 shows gender-based distribution. Table 5 shows item difficulty index…”
Example (Good):
“As shown in Table 3, students scored an average of 82 out of 100, with males slightly outperforming females. This supports the trend found in Table 4, where 62% of male respondents achieved scores above 85.”
See the difference? You’re using data to tell a story instead of listing numbers.
Use Data Visuals Wisely
Visuals like charts, graphs, and tables can be powerful—but only if you use them well.
Here are a few ways to improve data presentation:
- Introduce every chart or table before displaying it
- Keep visuals simple and readable
- Avoid using multiple colors unless necessary
- Summarize what the reader should notice
Also, don’t forget to refer to visuals by name. Instead of saying “The chart above,” say “Figure 2 below shows the distribution of responses.”
Use Transitions to Connect Data Sections
Even with great visuals and summaries, poor flow can make your reader feel lost.
To avoid that, use transitions like:
- “In addition to the previous results…”
- “Building on the findings from Table 2…”
- “This trend is also observed in Figure 4…”
- “The next section explores a different aspect of the data…”
These guideposts help your reader stay with you—even as the data gets deeper.
✍️ Need Help Presenting Your Data Clearly?
The Writeler Co. is here to support students and professionals who are juggling research with work, life, and business. Whether you’re writing a thesis, capstone, or dissertation for your master’s or Ph.D., we help you efficiently navigate the research journey — from brainstorming to proofreading.
📩 Message us today to get started.
📚 Let’s turn your research idea into a powerful paper.
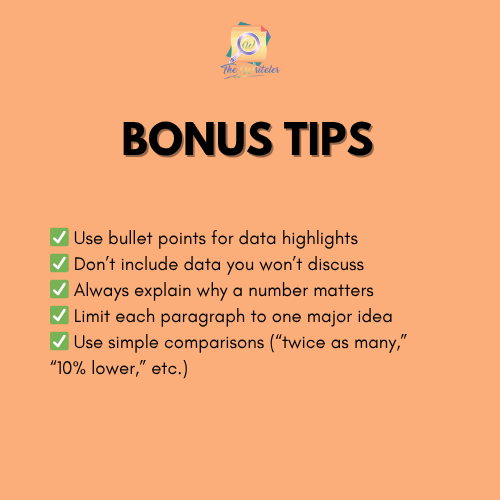
Extra Tips to Make Your Data Easy to Understand
Conclusion
In research, data is only as good as your explanation of it. No matter how solid your findings are, they can lose impact if they’re buried under too much information or poor organization.
To avoid data dumping:
- Choose what’s relevant
- Use clear visuals
- Explain your data simply
- Guide your reader using transitions
Treating your data like a story instead of a spreadsheet allows you to write chapters that are not only informative—but also enjoyable to read.
And remember: when in doubt, The Writeler Co. has your back.

0 Comments