

If you’ve ever stared at a list of statistical tool and thought, “Which one do I need?”—you’re not alone.
Choosing the right statistical method for your research isn’t just about looking smart in front of your thesis panel. It’s about selecting the tool that best fits your research question, data type, and objectives. The wrong tool can distort your findings, mislead your readers, or worse—get your work rejected during defense.
But don’t worry. This beginner-friendly guide will help you make sense of statistical tools and teach you how to pick the right one step by step.
What Are Statistical Tools in Research?
Statistical tools are techniques used to summarize, analyze, and interpret numerical data. In research, we usually deal with two main types:
- Descriptive statistics: These summarize and describe features of a dataset (e.g., mean, median, mode, standard deviation).
- Inferential statistics: These help us make conclusions, test hypotheses, or predict trends based on sample data (e.g., t-test, ANOVA, correlation, regression, chi-square).
Knowing which category your research falls under is the first step in identifying the right tool.
Key Questions to Ask Before Choosing a Tool
Before diving into formulas and SPSS, pause and ask yourself:
- What is my research question?
Are you comparing groups, testing relationships, or predicting something? - What kind of data am I working with?
Identify if your data is nominal (categories), ordinal (ranked), interval, or ratio (numerical). - How many variables am I analyzing?
Some tools work best with just two variables, others with multiple. - What’s the structure of my research design?
Is it descriptive, comparative, correlational, or predictive?
The answers to these guide your statistical decision.
Common Statistical Tools and When to Use Them
Here’s a cheat sheet you can use as a reference:
✅ Descriptive Statistics
- Mean, Median, Mode – Central tendencies for numerical data
- Standard Deviation, Range – Measures of spread or variability
These are perfect for quantitative descriptive studies where you’re just summarizing the “what” of your data.
✅ Tools for Comparing Groups
- T-test – Used when comparing the means of two groups (e.g., male vs. female performance)
- ANOVA (Analysis of Variance) – Used when comparing three or more groups
Use these when your goal is to determine if there’s a significant difference between groups.
✅ Tools for Testing Relationships
- Pearson’s r – Measures the strength of a linear relationship between two interval/ratio variables (e.g., study hours and GPA)
- Chi-square Test – Used to find relationships between categorical variables (e.g., gender and course preference)
These tools are for studies aiming to find connections between variables.
✅ Predictive Tools
- Simple Linear Regression – Predicts one variable based on another (e.g., predicting income based on years of education)
- Multiple Regression – Predicts one variable using two or more predictors (e.g., predicting stress based on workload and sleep hours)
These tools help you go beyond description and into prediction.
Choosing Based on Research Design
Here’s a quick match-up for reference:
| Research Type | Recommended Tool(s) |
|---|---|
| Quantitative Descriptive | Mean, SD, Frequency, Percentages |
| Comparative (2 groups) | T-test |
| Comparative (3+ groups) | ANOVA |
| Correlational | Pearson’s r / Spearman’s rho |
| Predictive | Regression Analysis (Simple/Multiple) |
Common Mistakes to Avoid
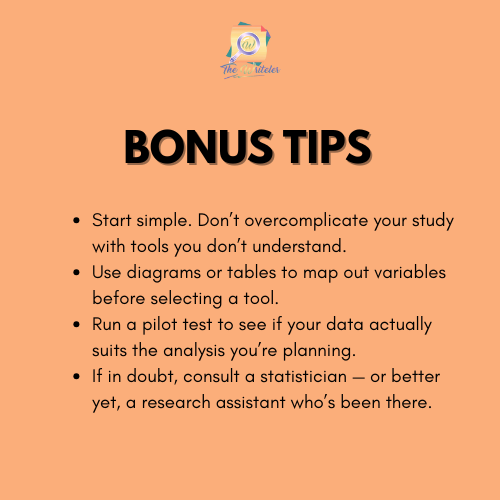
🚫 Using a tool just because it sounds “advanced”
Panelists can tell when you’re bluffing. Use the tool that makes sense, not the one that looks impressive.
🚫 Applying Pearson’s r to non-numerical data
This only works with interval or ratio data — not with categories like gender or type of business.
🚫 Using a t-test when comparing more than two groups
T-test is only for comparing two means. Use ANOVA for more.
🚫 Skipping assumption testing
Most tools (like t-tests and regressions) have statistical assumptions like normality or independence. Ignoring these can make your results invalid.
📣 Need Help Choosing or Running the Right Statistical Tool?
The Writeler Co. is here to support students and professionals who are juggling research with work, life, and business. Whether you’re writing a thesis, capstone, or dissertation for your master’s or Ph.D., we help you efficiently navigate the research journey — from brainstorming to proofreading.
📩 Message us today to get started.
📚 Let’s turn your research idea into a powerful paper.


0 Comments