

When conducting a quantitative research study, choosing the right data gathering tool isn’t just a technical step — it’s a foundational decision. Your tool is what connects your research questions to measurable answers. If you choose the wrong one, your data might be weak, unreliable, or completely irrelevant.
So how do you select the perfect tool that aligns with your objectives, respondents, and available resources?
This guide will walk you through the most commonly used tools in quantitative research, how to choose the right one, and what mistakes to avoid — all written in a simple and beginner-friendly format.
What is a Data Gathering Tool in Quantitative Research?
In research, a data gathering tool is any instrument used to collect numerical data from your chosen respondents. Unlike qualitative tools that aim to explore meaning, quantitative tools focus on measurable, objective facts — things you can count, score, or rate.
It’s important to distinguish:
- Tools = the actual instruments (e.g., questionnaire, checklist, test)
- Methods = how the tool is distributed (e.g., face-to-face, Google Forms, email)
Most Popular Tools for Quantitative Research
Here are the top tools used by students and researchers alike:
✅ 1. Surveys/Questionnaires
The most widely used tool. These usually contain structured, close-ended questions that use options like:
- Multiple choice
- Likert scales (e.g., strongly agree to strongly disagree)
- Yes/No
Best for:
- Large respondent groups
- Measuring perceptions, attitudes, or behaviors
Example: “How often do you use your mobile phone for schoolwork?”
✅ 2. Tests/Assessments
Used to evaluate performance, knowledge, or skills. They may be researcher-made or standardized.
Best for:
- Educational studies
- Comparing scores across groups
Example: A researcher-made 20-item math test to assess computation skills.
✅ 3. Observation Checklists
Used when measuring behavior or actions in a setting. These include specific indicators you tick or rate based on frequency or intensity.
Best for:
- Classroom studies
- Workplace behavior research
Example: “Student raised hand before speaking – Yes/No”
✅ 4. Existing Records or Databases
Sometimes, the best data already exists — like school records, government data, sales logs, or health reports. Just make sure you have access and it aligns with your variables.
Best for:
- Trend analysis
- Descriptive research
How to Choose the Right Tool
Now that you know your options, let’s break down the decision-making process:
🎯 1. Check Your Research Objectives
Your tool must answer your research questions. Are you measuring:
- Opinions?
- Skills?
- Behavior?
- Performance?
Each of these aligns better with a different type of tool.
Example: Measuring perception → questionnaire.
Measuring test scores → assessment.
👥 2. Know Your Respondents
Consider their age, education, language, and access to technology.
- Younger children may not understand Likert scales.
- Busy professionals may prefer short, digital forms.
Your tool should be accessible and easy to understand for your specific audience.
📊 3. Define Your Data Type
Quantitative data includes:
- Nominal (categories like gender)
- Ordinal (rankings like satisfaction level)
- Interval/Ratio (scores, temperature, time)
Make sure your tool captures the right level of data you need for analysis.
🧪 4. Check for Validity and Reliability
Don’t use a tool just because it “looks nice.” Make sure:
- It’s been tested and validated (look for past studies)
- Or, you’re planning a pilot test to validate it yourself
This ensures your results are trustworthy and defendable.
💰 5. Consider Time and Resources
- Can you afford to print 200 surveys?
- Do you have internet access for digital distribution?
- Is there time to conduct interviews or observations?
Your tool should match the realities of your resources.
Sample Scenarios
- Consumer Study: Use a Likert-scale questionnaire to assess purchasing behavior.
- Education Research: Use a standardized reading comprehension test to compare grade levels.
- Behavior Study: Use an observation checklist for classroom behavior.
- Business Thesis: Use company sales reports as secondary data.
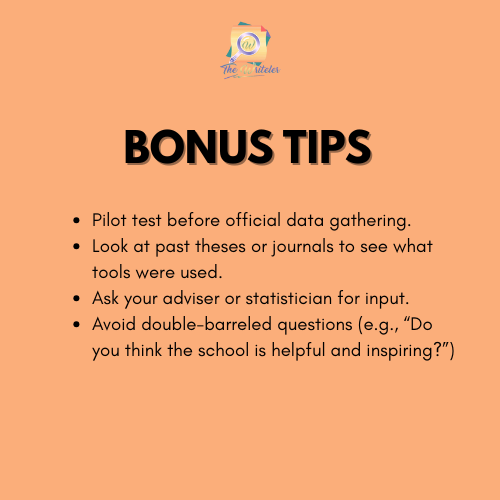
Common Mistakes to Avoid
🚫 Using a tool just because someone else used it.
🚫 Mixing open-ended and close-ended items without realizing it’s qualitative.
🚫 Asking leading or biased questions.
🚫 Not aligning the tool with the actual variables in the study.
Final Thoughts…
Your data gathering tool is not just a form — it’s the backbone of your entire study. A strong tool means strong data. And strong data means powerful conclusions.
Don’t rush this part. Reflect on your study’s needs, your participants’ situation, and your available resources. Then select a tool that’s both strategic and defendable.
📣 Need Help Building or Choosing the Right Tool?
The Writeler Co. is here to support students and professionals who are juggling research with work, life, and business. Whether you’re writing a thesis, capstone, or dissertation for your master’s or Ph.D., we help you efficiently navigate the research journey — from brainstorming to proofreading.
📩 Message us today to get started.
📚 Let’s turn your research idea into a powerful paper.


0 Comments