
Chapter 4 is where your research finally breathes. It’s where all the data you gathered starts making sense — not just to you, but to your readers and thesis panel. But here’s a mistake many students make: they present all their tables and figures in bulk and save the explanations for later. The result? A confusing, disjointed chapter that leaves readers guessing.
The solution? Organize Chapter 4 by research questions. It’s clean. It’s logical. And most importantly, it helps your reader follow your argument from data to conclusion without getting lost.
Let’s break down how you can do just that — step-by-step.
Why Organize by Research Questions?
Your research questions are the core of your study. They guided your data gathering, your methodology, and now they should shape your data presentation. Here’s why this approach works:
- ✅ It keeps Chapter 4 aligned with your research objectives.
- ✅ It makes the structure more reader-friendly and easy to follow.
- ✅ It prevents data from feeling “dumped” or out of context.
- ✅ It sets you up for a smoother Chapter 5, since your findings will already be categorized.
In short, organizing by RQ makes you look more focused, professional, and credible.
Before You Write: Prepare Your Data Strategically
Before you dive into writing, take a moment to do these 3 things:
1. List your research questions.
Have them written out in the exact phrasing used in your Chapter 1.
2. Match each RQ with your gathered data.
Figure out which survey items, interview themes, or variables relate to which question.
3. Decide the right analysis method.
For each RQ, will you use descriptive stats, inferential tests (like t-tests or ANOVA), or qualitative coding themes?
Once your data is sorted and linked to each research question, writing becomes much easier.
Writing the Chapter: Section by Section
Here’s the repeatable structure you’ll follow for each RQ:
✅ 1. Restate the Research Question
Start each section with a heading like:
Research Question 1: What are the most common study habits among Grade 12 students?
This reminds the reader what you’re trying to answer.
✅ 2. Present the Relevant Data
Include the charts, tables, or thematic summaries that relate directly to that question.
📌 Example: A frequency table showing study habits used by 120 respondents.
📌 For qualitative data: A paragraph highlighting coded themes like “morning routines,” “cramming,” or “group reviews.”
Use clear labels and titles for all visuals (e.g., Table 1: Frequency of Study Habits).
✅ 3. Interpret the Data
Don’t just describe — explain.
📌 Example:
“The data shows that 62% of respondents preferred studying in the morning, while only 15% studied at night. This suggests a strong preference for early-day study sessions.”
If you ran statistical tests, mention the results (e.g., p-values, correlation strength) in plain language.
✅ 4. Connect to the Study’s Objective
Tie the data back to the bigger picture.
📌 Example:
“These findings support the hypothesis that early study habits are common among high-performing students.”
This step helps keep your research grounded and meaningful.
Sample Structure for Chapter 4 (Organized by RQ)
Here’s how your actual chapter might look:
Chapter 4: Presentation, Analysis, and Interpretation of Data
- Introduction
(Brief summary of what’s inside the chapter, methods used, and how the data will be presented.) - Research Question 1
- Data presentation
- Interpretation
- Connection to objectives
- Research Question 2
- Data presentation
- Interpretation
- Connection to objectives
(Continue this pattern for all RQs)
- Summary of Findings (Optional)
(A paragraph or two summarizing key takeaways.)
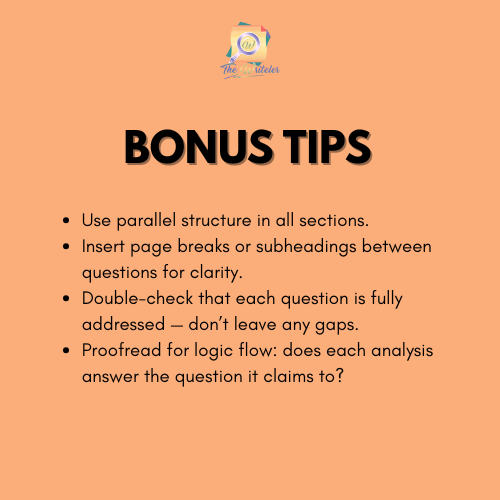
Common Mistakes to Avoid
🚫 Presenting all data first, then discussing it later.
Readers will lose context. Explain each dataset as you go.
🚫 Skipping the research question headings.
These help the reader stay oriented.
🚫 Rewriting your entire table in the paragraph.
Summarize only what’s important — don’t repeat every number.
🚫 Inconsistent structure across questions.
Keep each RQ section formatted similarly for professionalism and clarity.
When done well, Chapter 4 becomes more than just “data dumping.” It becomes the story of your research, told in a way that flows, makes sense, and impresses.
📣 Need Help Making Chapter 4 Flow Smoothly?
The Writeler Co. is here to support students and professionals who are juggling research with work, life, and business. Whether you’re writing a thesis, capstone, or dissertation for your master’s or Ph.D., we help you efficiently navigate the research journey — from brainstorming to proofreading.
📩 Message us today to get started.
📚 Let’s turn your research idea into a powerful paper.

0 Comments