

When writing your research paper or thesis, Chapter 4 is where your data comes to life. It’s not just about numbers—it’s about making sense of those numbers through inferential statistics. While descriptive statistics describe what your data looks like, inferential statistics help you draw conclusions, test hypotheses, and make predictions that go beyond your sample.
In this guide, we’ll walk you through how to perform inferential statistics in Chapter 4, explain when and why you need them, and help you avoid common errors that could affect your credibility.
What Are Inferential Statistics and Why Do They Matter?
Inferential statistics allow you to move from sample data to general conclusions about a larger population. Instead of simply stating what your data shows, you’re using logic and probability to infer what your results mean in a broader context.
Some common inferential methods include:
- T-tests – comparing means between groups
- ANOVA – testing variance across multiple groups
- Correlation and Regression – identifying relationships between variables
- Chi-square tests – analyzing categorical data relationships
- Confidence intervals – estimating population parameters
In Chapter 4, this is your chance to demonstrate whether your hypotheses are supported and whether your findings hold statistical weight.
Preparing Your Data for Inferential Statistics
Before diving into tests, ensure your dataset is clean and meets the necessary statistical assumptions:
- Are your variables normally distributed?
- Do you have enough sample size?
- Are variances equal across groups?
Choosing the right inferential statistics tool depends on:
- The type of data (nominal, ordinal, interval, or ratio)
- The number of groups or variables you’re comparing
- The research question you’re answering
For example, comparing two independent groups means? Go for a t-test. Examining frequency counts in categories? Try a Chi-square test.
Performing Inferential Statistics: A Step-by-Step Guide
Let’s explore how to perform inferential statistics using some of the most common methods used in research.
✅ T-tests
Use when comparing two group means (e.g., males vs. females).
- Independent t-test: For separate groups
- Paired t-test: For before-and-after or matched samples
Report as: t(df) = value, p = value
Example: t(28) = 2.31, p < 0.05
✅ ANOVA (Analysis of Variance)
Use when comparing more than two groups (e.g., test scores across 3 teaching methods).
- Check if at least one group mean is different
- Follow up with posthoc tests if significant
Report as: F(df1, df2) = value, p = value
✅ Chi-square Test
Great for testing relationships in categorical data (e.g., gender vs. preference).
- Compares observed vs. expected frequencies
Report as: χ²(df) = value, p = value
✅ Correlation and Regression
- Pearson’s correlation: Measures strength and direction of linear relationship
- Simple Linear Regression: Predicts outcome variable
Report as:
Correlation: r = 0.76, p < 0.01
Regression: R² = 0.58, F(1,28) = 12.31, p = 0.002
Each method of inferential statistics requires correct test assumptions, valid data entry, and clear hypothesis framing.
Presenting Inferential Statistics in Chapter 4
When writing Chapter 4, your goal is to present inferential statistics clearly and concisely:
- Use tables and figures to support your findings
- Always report test name, statistic, degrees of freedom, and p-value
- Use APA style or your institution’s preferred formatting
- Don’t just dump numbers—interpret what they mean about your research questions
Example excerpt:
“There was a significant difference in post-test scores between the control group (M = 78.5) and the experimental group (M = 84.2), t(58) = 2.94, p = 0.005.”
Common Mistakes When Doing Inferential Statistics
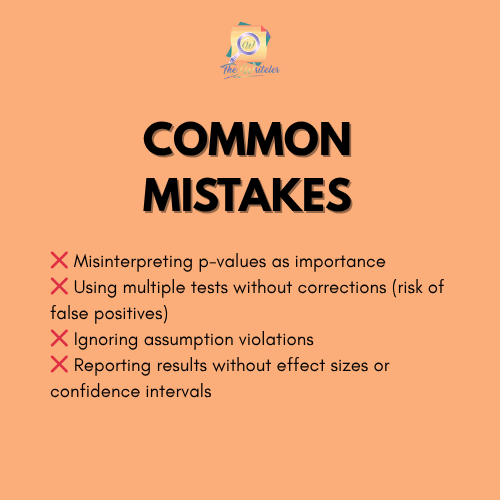
Proper use of inferential statistics isn’t just about getting a “p < 0.05″—it’s about sound reasoning, transparency, and integrity in reporting.
Interpreting Inferential Statistics in the Discussion Section
Once your results are in, Chapter 5 (or later part of Chapter 4) is where interpretation happens:
- Compare findings to related studies
- Explain potential reasons for unexpected results
- Avoid overstating significance or causality
- Discuss limitations and suggestions for future research
Use inferential statistics not just to impress, but to express—what do these numbers mean in real life?
🖊️ The Writeler Co. Writing Services Can Help
The Writeler Co. is here to support students and professionals who are juggling research with work, life, and business. Whether you’re writing a thesis, capstone, or dissertation for your master’s or Ph.D., we help you efficiently navigate the research journey — from brainstorming to proofreading.
📩 Message us today to get started.
📚 Let’s turn your research idea into a powerful paper.
Conclusion
Mastering inferential statistics in Chapter 4 is one of the most powerful ways to show your readers (and reviewers) that your findings are not just descriptive—they are meaningful, tested, and reliable. From choosing the right test to presenting your results in context, the key is to focus on clarity, transparency, and interpretation.
Use your statistics to tell a story—and if you need help, The Writeler Co. is just a message away.


0 Comments